SysTools Exchange Log AnalyzerSysTools
|
||||||
Related Products
|
||||||
About
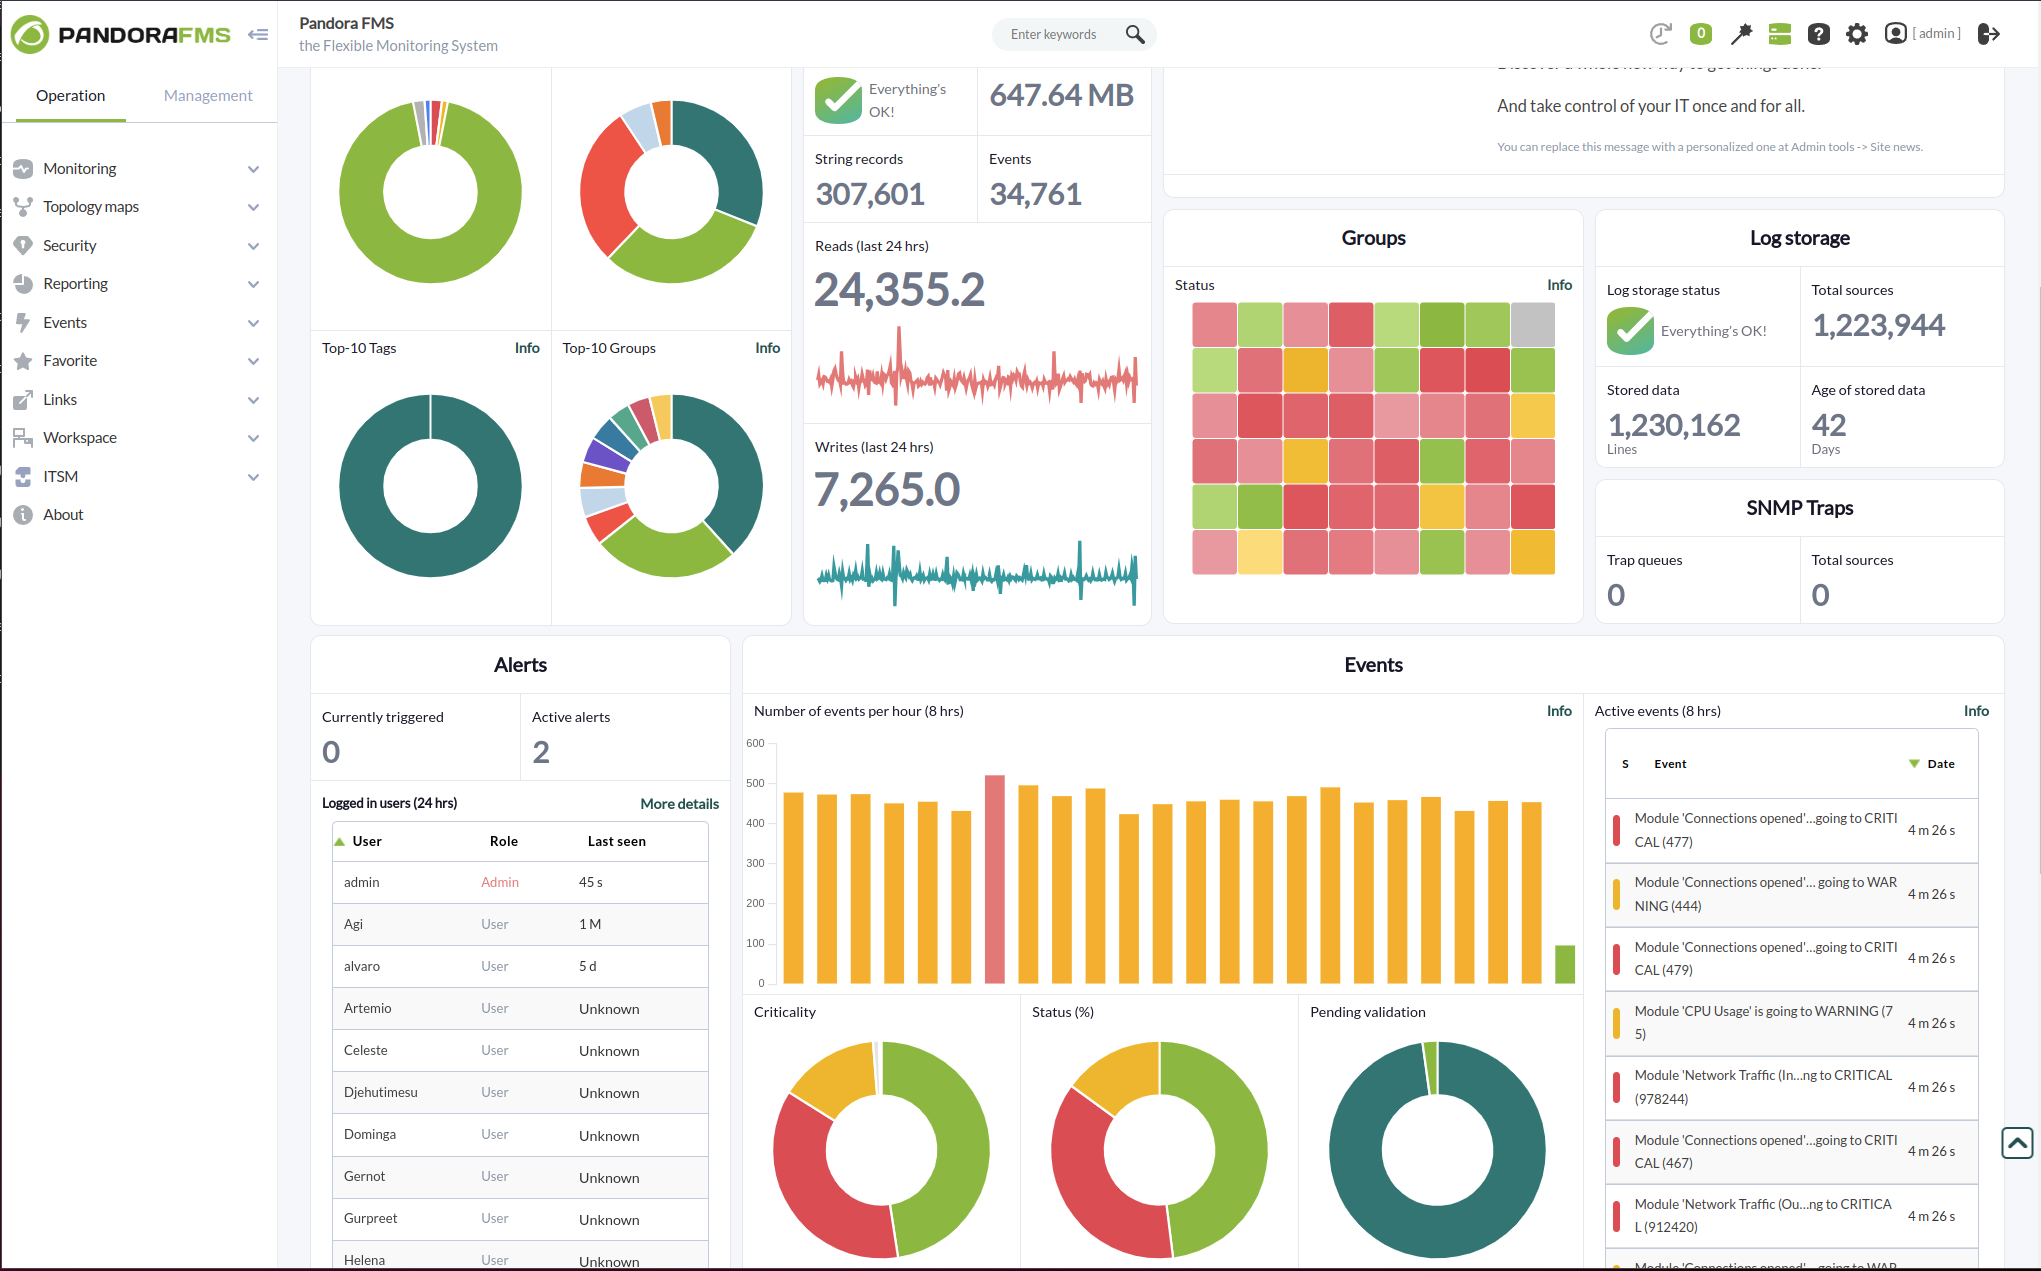
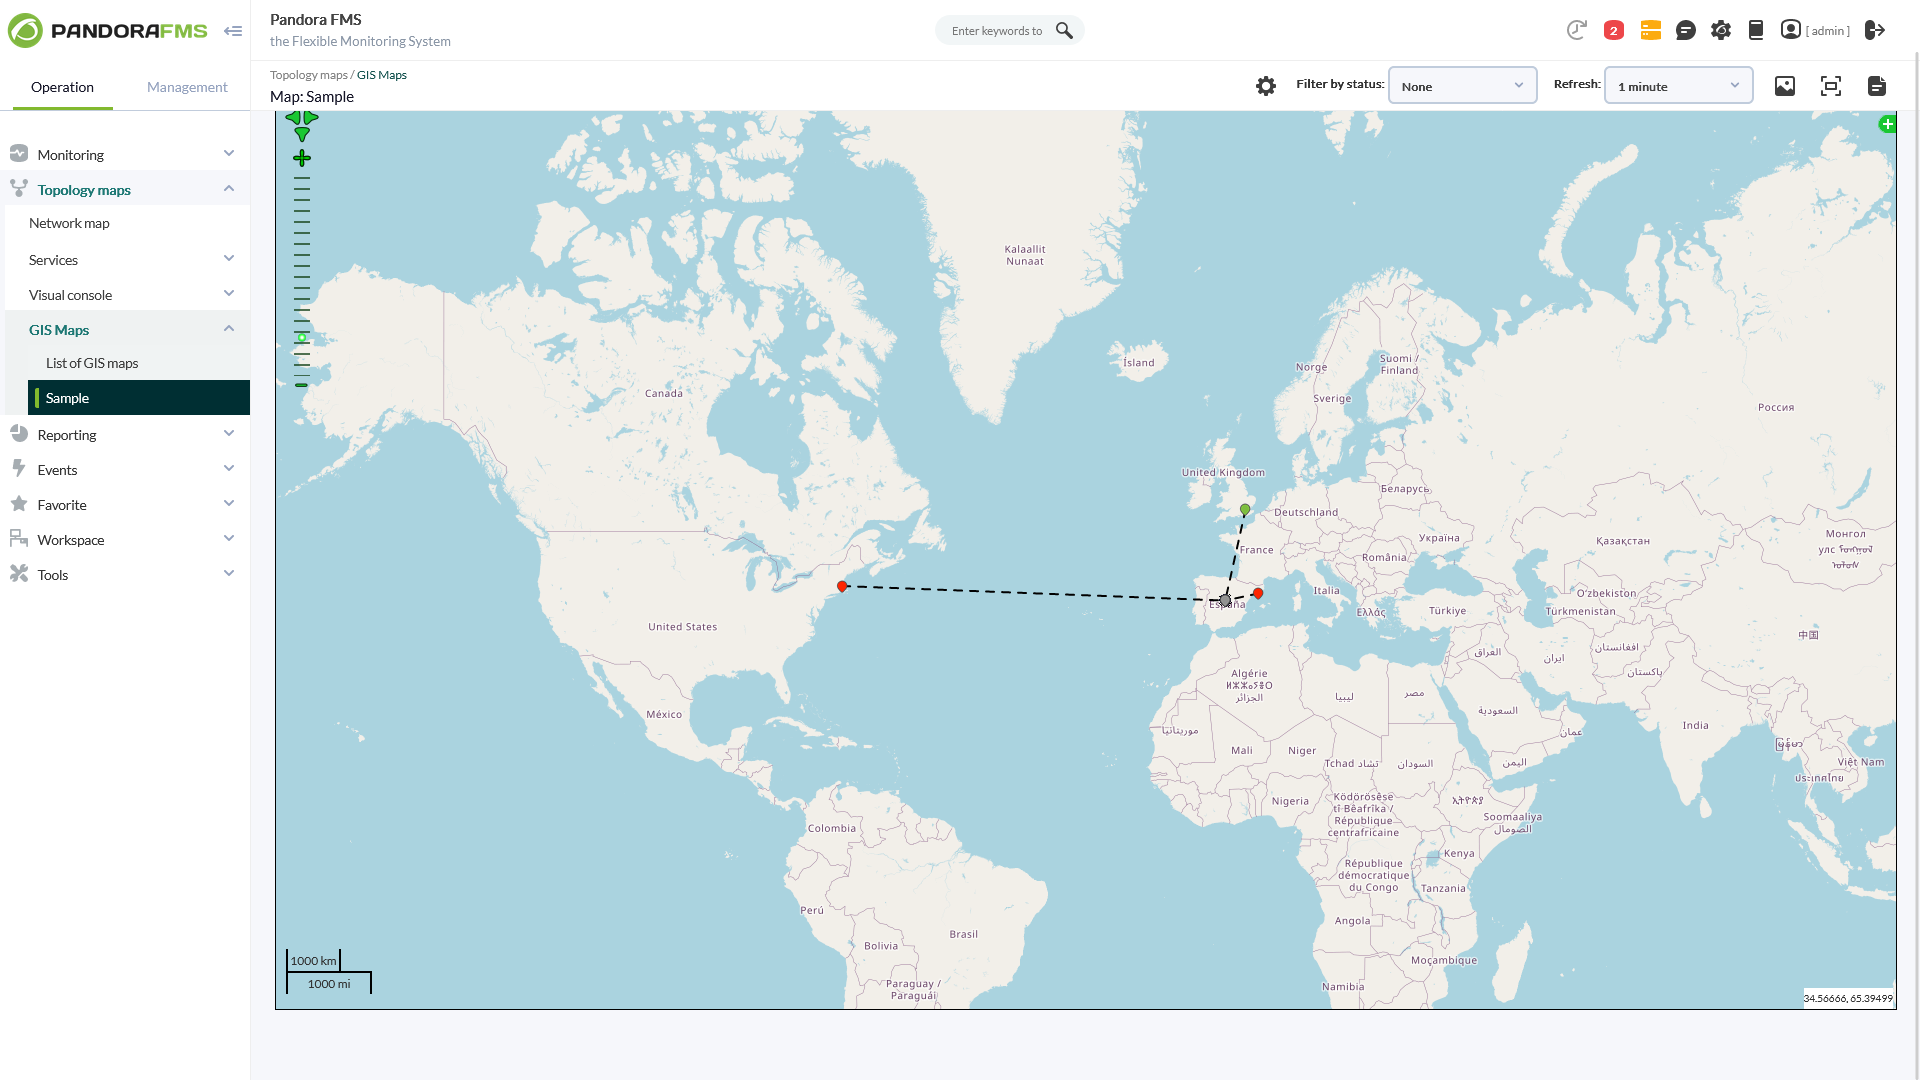
With more than 50,000 customer installations across the five continents, Pandora FMS is a truly all-in-one monitoring solution, covering all traditional silos for specific monitoring: servers, networks, applications, logs, synthetic/transactional, remote control, inventory, etc.
Pandora FMS gives you the agility to find and solve problems quickly, scaling them so they can be derived from any source, on-premise, multi cloud or both of them mixed. Now you have that capability across your entire IT stack and analytics to find any problem, even the ones that are hard to find.
Thanks to more than 500 plugins available, you can control and manage any application and technology, from SAP, Oracle, Lotus, Citrix or Jboss to VMware, AWS, SQL Server, Redhat, Websphere, etc.
|
About
Provides a save scan option to load the saved exchange log file. Export scanned Exchange files into multiple file formats. Provides support for export as PDF, MSG, EML, and HTML options. Exchange log analyzer provides the option to repair corrupt Exchange log files. Provision to analyze Exchange server log file along with all data items. It does not impose any edb.log file size limitation. EDB file is necessary to analyze and open Exchange log files. Supports various Exchange versions to extract emails from Exchange database files. Option to perform a date-based filter on Exchange Log files. A user can use the Exchange Log Analyzer tool to view & load transaction edb.log of the Exchange server. The software will first analyze the Exchange log reader file and then, provide a view of all the required data such as emails from Exchange Server 2016, 2013, 2010, and 2007 transaction log files file. However, it is necessary to have an EDB file also to perform log analysis.
|
|||||
Platforms Supported
Windows
Mac
Linux
Cloud
On-Premises
iPhone
iPad
Android
Chromebook
|
Platforms Supported
Windows
Mac
Linux
Cloud
On-Premises
iPhone
iPad
Android
Chromebook
|
|||||
Audience
All kind of IT environments, from just a few to several thousand devices
|
Audience
Companies requiring a tool to view exchange server transaction log files
|
|||||
Support
Phone Support
24/7 Live Support
Online
|
Support
Phone Support
24/7 Live Support
Online
|
|||||
API
Offers API
|
API
Offers API
|
|||||
Screenshots and Videos |
Screenshots and Videos |
|||||
Pricing
€90/month
Free Version
Free Trial
|
Pricing
$29 per month
Free Version
Free Trial
|
|||||
Reviews/
|
Reviews/
|
|||||
Training
Documentation
Webinars
Live Online
In Person
|
Training
Documentation
Webinars
Live Online
In Person
|
|||||
Company InformationPandora FMS
Founded: 2005
Spain
pandorafms.com
|
Company InformationSysTools
Founded: 2007
India
www.systoolsgroup.com/exchange-log-analyzer.html
|
|||||
Alternatives |
Alternatives |
|||||
|
|
|
|||||
|
|
||||||
|
|
||||||
|
|
|
|||||
Categories |
Categories |
|||||
Business Activity Monitoring Features
Alerts / Notifications
Business Process Management
Cross Application Analysis
Email Monitoring
Events Monitoring
KPI Monitoring
Pre-Configured Events
Reporting / Analytics
Workflow Management
Cloud Management Features
Access Control
Billing & Provisioning
Capacity Analytics
Cost Management
Demand Monitoring
Multi-Cloud Management
Performance Analytics
SLA Management
Supply Monitoring
Workflow Approval
Database Monitoring Features
Anomaly Detection
Autodiscovery
Capacity Planning
Dashboard
Dependency Tracking
Historical Trend Analysis
Multitenancy
Notifications / Alerts
Performance Monitoring
Permissions / Access Controls
Predictive Analytics
Prioritization
Query Analysis
Resource Optimization
Troubleshooting
IT Alerting Features
Alert Noise Reduction
Alert Routing
Dynamic Notifications
Enriched Incident Context
Escalation Policies
Incident History Audit
Multi-User Alerting
Multiple Alert Types
On-Call Management
Rich HTML Email Notifications
IT Infrastructure Monitoring Features
Alerts / Notifications
Application Monitoring
Bandwidth Monitoring
Capacity Planning
Configuration Change Management
Data Movement Monitoring
Health Monitoring
Multi-Platform Support
Performance Monitoring
Point-in-Time Visibility
Reporting / Analytics
Virtual Machine Monitoring
Network Mapping Features
Color Codes / Icons
Compliance Management
Device Auto Discovery
Hierarchical Mapping
Location-Based Mapping
Map Exporting
On-Demand Mapping
Reporting/Analytics
Self-Updating Maps
Web Traffic Reporting
Network Monitoring Features
Bandwidth Monitoring
Baseline Manager
Diagnostic Tools
Internet Usage Monitoring
IP Address Monitoring
Real Time Analytics
Resource Management
Server Monitoring
SLA Monitoring
Uptime Monitoring
Web Traffic Reporting
RMM Features
Deployment Management
For MSPs
IT Asset Management
Mobile Access
Network Monitoring
Patch Management
Real-time Alerts
Remediation Management
Server Management Features
CPU Monitoring
Credential Management
Database Servers
Email Monitoring
Event Logs
History Tracking
Patch Management
Scheduling
User Activity Monitoring
Virtual Machine Monitoring
System Monitoring Features
Alerts / Notifications
Antivirus Management
Data Backup / Recovery
Device Monitoring
Inventory Management
Patch Management
Policy-based Automation
Remote Monitoring
Reporting / Analytics
Risk Analysis
Server Monitoring
Service Configuration Management
Website Monitoring Features
Availability Testing
Event Logs
Event-Based Notifications
FTP Monitoring
Mail Server Monitoring
Maintenance Scheduling
Performance Metrics
Real Time Monitoring
Transaction Monitoring
Uptime Reporting
|
||||||
Integrations
Akamai Cloud
Alfresco Digital Business Platform
Apache Tomcat
Aruba Cloud
Azure Marketplace
BlackBerry Notes
IBM Db2
JBoss EAP
Jetty
Microsoft IIS
|
Integrations
Akamai Cloud
Alfresco Digital Business Platform
Apache Tomcat
Aruba Cloud
Azure Marketplace
BlackBerry Notes
IBM Db2
JBoss EAP
Jetty
Microsoft IIS
|
|||||
|
|
|